STOCK'S KNOWS

Friday, May 4, 2018

Candlestick Patterns: Part 2

Candlestick Patterns: Part 2

Hey friends, welcome to Stock’s Knows. This is the 2nd part of candlestick pattern article. In this article will understand candlestick patterns formed by 2 candlesticks.

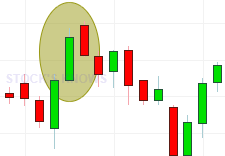
  1)Bullish Engulfing:
  Bullish Engulfing candlestick pattern forms by 2 candles, the first candle is generally small and bearish, the 2nd candle is bullish and long. 2nd candle engulfs the first one. This type pattern is known as a Bullish Engulfing pattern. It is a bullish reversal pattern and in most of the cases, it found near the bottom at the end of the downtrend. If next candle closes above the high of a 2nd candle, it clearly indicates upcoming uptrend. 

Bullish Engulfing as bullish reversal pattern


  2)Bearish Engulfing:
  It is also two candle pattern. The 1st candle is always small and bullish, a 2nd candle is long and bearish. 2nd candle fully engulfs the first one. It majorly forms at the end of uptrend hence it is a bearish reversal pattern. When 3rd candle will close below the low of the 2nd candle, it clearly indicates an upcoming downtrend.

Bearish Engulfing Candlestick Pattern as Bearish reversal


 3)Bullish Harami:
 Bullish Harami pattern is a mirror image of the bullish engulfing pattern. In bullish harami pattern, the 1st candle is long and bullish. The 2nd candle is small and bearish. A 2nd candle always in between high and low of the first candle. It forms generally at the bottom, end of the downtrend. It is a bullish reversal pattern. If 3rd candle closes above 1st candle’s high, it clearly indicates upcoming uptrend.

Bullish Harami Candlestick Pattern as Bullish reversal

4)Bearish Harami:
Bearish Harami pattern is the mirror image of the Bearish Engulfing pattern. The 1st candle is always long bearish candle and the 2nd candle is always small bullish candle. 2nd candle forms in between High and low of the 1st candle. It is bearish reversal pattern and forms generally at the end of an uptrend. If 3rd candle closes below Low of the 1st candle, it is clear indication of the upcoming downtrend.
Bearish Harami candle as bearish reversal pattern

5)Dark cloud cover:
Dark cloud cover is also bearish candlestick pattern. In this pattern, the 1st candle is a strong bullish candle, but the 2nd candle is a strong bearish candle and opens above the high of the 1st candle, close below the midpoint of the first candle. It forms near the resistance zones.


Dark Cloud Cover as Bearish Reversal pattern

6)Piercing Line candlestick pattern:
Piercing Line pattern is just mirror image of Dark cloud cover pattern. The first candle is always strong bearish candle and 2nd candle open below the low of the 1st candle and close above the midpoint of the 1st candle. It is a bullish reversal pattern. It generally forms near the support zone.

Piercing Line as Bullish reversal pattern

7)Tweezer tops:
The tweezer top is the bearish reversal pattern. A 1st candle is the strong bullish candle and closes at high. The 2nd candle is a bearish pattern and opens at high-level decrease to a lower level. Highs of both candles are almost same. It generally forms at the end of an uptrend.

Tweezer Top as Bearish reversal pattern

8)Tweezer bottoms:
The tweezer bottom is the bullish reversal pattern. The 1st candle is the strong bearish candle, close at the low level. 2nd candle open at low and increase from that level and close near high. Lows of both candles are almost same. It generally forms around support zones and at the ending of the downtrend.
Tweezer Bottom as Bullish reversal pattern


This was the 2nd part of candlestick pattern article. In 3rd part, we will understand about candlestick pattern formed by more than two candles. If you find helpful above information then please Share our article and Subscribe to the newsletter of our blog.  

Thursday, May 3, 2018

Candlestick Patterns: Part 1

Candlestick Patterns: Part 1

Hey friends, welcome to Stock’s Knows. This is the 4th article of technical analysis. In this article, we will learn about some candlestick patterns and their interpretation. Candlestick charts are most useful charts because different types of candlestick patterns have their different interpretation which is very helpful to understand the market.
    
  1)Marubozu:
   A candlestick pattern which has the only body but no shadow or small shadow is known as marubozu. A rarely found marubozu candlestick pattern is of both types bullish and bearish. For bullish marubozu, always open equals Low and Close always equals high, in bearish Marubozu open equals High and Close equals Low. Marubozu type candlestick pattern can be both continuation and reversal pattern.

Morubozu bearish and bullish candles
Marubozu as Bullish continuation pattern:
If you find Bullish marubozu in the uptrend, it indicates the continuation of that uptrend.
Example of bullish marubozu

Marubozu as Bullish reversal pattern:
If you find Bullish marubozu after the downtrend, it is the indication of a reversal of trend and uptrend may be coming.
Example of bullish reversal by marubozu


Marubozu as Bearish Continuation pattern:
If you find Bearish marubozu in the downtrend it is the indication of the continuation of that downtrend. 
Bearish Marubozu as bearish continuation pattern

Marubozu as bearish reversal pattern:
If you find bearish marubozu after the uptrend, it is the indication of trend reversal may be coming.
Bearish marubozu as bearish reversal pattern


2)Spinning top :
    In spinning top candlestick pattern, a body is very small as compare to shadows. Generally, shadows are more than double size of the body. This looks like a spinning top toy, so it named as spinning top candle. It is the sign of indecision and it generally forms at the end of an uptrend or a downtrend. After spinning top candlestick pattern one need to wait for next candle, which will indicate the situation.
Spinning Top candlestick pattern can indicate both bullish and bearish reversal.

Spinning top as bullish  trend reversal:
Spinning Top example

Spinning Top as Bearish Trend Reversal:
Spinning top as Trend reversal


  3)Doji:
    Doji patterns have very small or nobody and long shadows, there are four types of doji patterns:

a)Gravestone doji,
b)Dragonfly doji,
c) Doji 
d)Long-legged Doji

    a)Gravestone Doji generally forms after an uptrend and it is the indication of the end of an uptrend or reversal of an uptrend and downtrend might start.
Gravestone Doji as bearish reversal

b)Dragonfly doji generally forms after a downtrend and it is the indication of an end of downtrend or reversal of trend and uptrend might start.

Dragonfly Doji as bullish reversal

 c)Doji forms both after the uptrend or after the downtrend. If it forms after the uptrend, it indicates the bearish trend reversal. If it forms after the downtrend, it indicates the bullish trend reversal.

Doji as Bearish reversalDoji as Bullish reversal

d)Long-legged doji forms after both of trends. If it forms after uptrend it indicates the bearish trend reversal ( or indecision) and if it forms after downtrend it indicates bullish trend reversal (or indecision).
Long Legged Doji

     3)Hammer and Inverted Hammer pattern:


 i)Hammer candlestick pattern looks like the hammer, it has the small body, small upper shadow, and longer lower shadow. There is no bullish or bearish hammer, hammer generally forms after significant downtrend near the bottom of the downtrend. whether it has the bullish body or bearish body it indicates that bottom may be hammered out and uptrend might start. Price will go up from here.
Hammer candlestick pattern as bullish reversal pattern

ii)Inverted hammer candlestick pattern looks like the inverted hammer, it has the small body, small lower shadow, and long upper shadow. Generally, length of the shadow is more than double of the length of the body. It generally forms after both uptrend and downtrend. If it forms at the bottom, after significant downtrend it indicates that buyers are coming back and sellers are exhausted.


Inverted Hammer as Bullish reversal candlestick pattern
iii)Shooting star:
   If inverted hammer form at the top, after significant uptrend it is known as shooting star because it looks like when a star shooting from the sky. If low of shooting star breaks in next candle it clearly indicates of bearish reversal and downtrend might come because of sellers are back in the game.

Shooting star Candlestick as Bearish reversal

This was the part 1 of candlestick patterns, in 2nd part will understand candlestick patterns formed by more than one candle. If you find helpful above information then please Share our article and Subscribe to the newsletter of our blog.  

Tuesday, May 1, 2018

Basics of trading and important things to know while trading.

Basics of trading and important things to know while trading.

Hey friends, welcome to Stock’s Knows. This is the 3rd article of Technical Analysis, in today’s article, we will know Basics of Trading.

What is Trading?
Trading is a method to make a profit from buying and selling shares or security or currency during the shorter time frame. There are different types of traders in the market. Risks, rewards and time frames are different for different types of traders. We can classify mainly three types of traders shown in the market.

   1)Intraday Trader:
   An intraday trading is a method to get profit from changes in the price of shares during the day. An intraday trader needs to close his opened position before closing the market, whether it is a profitable position or losing position. Intraday traders are players which play in direction of Market.

Intraday traders always try to book their profit quickly or cut loss quickly. Though intraday trading removes the overnight risk of carrying shares, it is not the easy task to do.

     2)Positional Trader:
     Positional trading is like day trading but positional traders do not square off their position before closing the day but they take their position in any security and hold for some days to the week and try to get profit from changes in share price during some time period. 

 Although it consists of overnight carrying risk, as per my view in positional trading you have some more time as compare to intraday to take decisions as per your risk or reward capacity. They book profit or cut losses as per their plan on basis of the movement of share or security price. 

   3)Short term or Swing Trader:
   Short term or swing trading is trading for a time period of 1 week to 4 weeks. A swing trader always tries to get profit from market swings during some weeks. Swing trading also carries Overnight holding risk but it is less risky as compared to intraday and positional trading as per my view.

They always buy at low and sells at high. Risk and reward in swing trading are different from both above types of trading. Though all types of trading are risky but if you trade strictly as per your plan, you will get profit in the long run.

Some important things to decide while trading:
     
  1)The risk to reward ratio:
The risk to reward ratio is first important thing while trading. The risk to reward ratio is defined as: How much reward you expect per share while taking risk of Rs.1 per share. 

If you expect Rs.5 per share as a reward while taking risk of Rs.1 per share your risk to reward ratio will be “1:5” (Risk: Reward or Risk/Reward). Higher the reward compares to risk better it is. A ratio of 1:5 is better than 1:1 ratio.

For different type trader risk to reward is a different but minimum risk to reward ratio is always 1:1 because minimum reward while taking risk of Rs.1 per share is not less than Rs.1 per share.

  2)Target:
Target is a level near that one need to book full or partial profit. Booking profit is very important because the market is always volatile and if someone waits for more and more profit and not book profit, it is possible that market may reverse its direction and profitable position will become losing position. 

To avoid those scenarios one needs to set the target and continue to book at least partial profit. In above condition trailing stop loss will help you.

  3)Stop loss:
In any type of trading cutting losses is as much important as booking profit. STOP LOSS is a level beyond that one need to square off his position to cut the loss as per his risk-carrying capacity.

As per trader’s risk to reward ratio and on the basis of charts, stop loss must be decided. Because of news, events, and volatility, the market can change its direction any time. 

To protect himself from that volatility and to limit the losses, one always need to place stop loss orders. 

If you are in buy side, your stop loss level would be just below the nearest support level, if you are in sell-side your stop loss level must be above the nearest resistance level. 

There are many support and resistances possible in any price range, one needs to decide that where to put stop loss as per his risk to reward ratio and as per his trading style. 

There are different stop loss levels in the same position for Intraday or Positional or swing trader. 

In trading, many people because of emotions prevent to cut losses earlier and think the market will reverse to give him reward so they hold their positions but an ideal trader do the exact opposite of it, he always tries to cut losses quickly and try to run his profitable position

Thinking that market will reward me because so and so reason is not good quality of a trader. 

Accepting whatever real condition is, the best quality of a trader. If you want to be profitable in trading you need to do like the ideal trader.
              
 Types of STOP LOSS:
    
    1)Trailing stop loss:
      Trailing stop loss is moving stop loss which moves in favor of the position as price goes in favor of the opened position. 

   If you have bought some shares at 200 and your stop loss is at 196, suppose price moves from 200 to 204 then you need to increase stop loss from 196 to 200, in this condition your trade is protected and you won’t lose anything. 
   After sometime price further increases to 208 then you need to increase your stop loss to 204, in this condition your profit of Rs.4 per share is locked and in any market condition you will get minimum that profit. This is known as trailing stop loss.

  No.  CONDITION       STOP LOSS      PRICE
  1)  Just Bought        196           200
  2)  After some time    200           200
  3)  More time passed   200           208


    2)Fixed stop loss:
   After understanding about trailing stop loss, you will think people need to always use trailing stop loss, but it is not true. 

Sometime trailing stop loss will give unnecessary losses, because in the highly volatile market it is possible that price of purchased share suddenly decrease and hit your stop loss and quickly increase from that level and hit your target, but your position was squared off and you will get the unnecessary loss. 

So trailing stop loss is a good idea but not in all cases. In the highly volatile market, you have to increase your risk, need to find strong support below that you can put stop loss, to increase the probability of hitting it. 

In that case, you can not trail your stop loss. This type of Stop loss is known as strict or fixed stop loss.

This was some basic and important things of trading.

If you find helpful above information then please Share our articles and Subscribe to the newsletter of our blog.  

Monday, April 30, 2018

10 Most Important Fundamental Parameters of a Company.

10 Most Important Fundamental Parameters of a Company.
Hey friends, welcome to 2nd article of fundamental analysis of Stock’s Knows. In this article, we will know 10 Most Important Fundamental Parameters of a Company.

1)Market Capitalization (Market Cap):
Market cap is a representation of a value of a company in the market. Higher the market Cap larger the company’s size. Market Cap is calculated by multiplying a company’s share price with its total number of outstanding shares in the market.
i.e.If a company’s share price is Rs.100/share and a number of outstanding shares in the market are 100 then Market Cap of a company will have calculated:

Market Cap = (Price of a share x Total Number of Outstanding Shares)
          =(100x100)
          = Rs.10000

Total Value of that company in market is  Rs.10000.Companies also categorized in terms of market cap: Large Cap, Mid Cap, Small Cap.

Large-cap companies are large size companies, which are in their businesses from decades or some from a century. Hence, they are less risky as compare to any other.

Mid Cap companies are larger than Small Cap companies but smaller than Large-cap companies. They are less risky than Small Cap companies but riskier than large-cap companies.

Small Cap Companies are smaller in size. They are higher riskier than both above types of companies.


  2)Book Value:
  Book value is another type of the value of a company. It is a value as per company’s books. It is the difference between a company’s total assets and total Liabilities. It is shareholder’s total fund for a company.

If we divide Book Value of a company to a total number of outstanding shares of a company, then we will get Book Value per share of a company. Which is the value of 1 share of a company as per its books?

We can calculate the price to book value per share for a company by dividing a company’s share price with its book value per share. 

From which we can analyze the price of a company, how much times the price is currently as compared to its book value. Higher the Price to book value, higher the valuation of a company.

  3)Face Value:
   Face Value is the original value of a share, which is printed on share certificate. In previous days shares were issued in certificate form. 1 certificate for 1 share. Now because of regulatory rules, all shares are dematerialized saved in Demat account of Shareholders. In India generally, the face value of a company is between 1 to 1o.


  4)Market Value or Market Price:
  Market price is a company’s current share price as per Stock Exchanges where it is listed. Market value is also the sum of Face Value and Premium given by Market to a share.

5)Dividend and Dividend Yield: By Investing in shares of a company, one can get benefit from two sides: 1)Dividend  2)Capital Appreciation.

1)Dividend:
  It is some part of a company’s earnings, which is paid to its shareholders on the behalf of taking the risk in that company. 
  
  It is very important to note that paying the dividend is not compulsory, it depends on the company, whether to give dividend or to use that capital to improve company’s growth. A dividend is given as a percentage of a company’s face value. i.e. If a company declares the dividend of 150% and a face value of it is Rs.1 then the company will pay Rs.1.5 per share to its shareholders.

2)Capital Appreciation: 
  It is in terms of increase in share price which is purchased by shareholders. i.e. In June 2016, the per share price of MRF was more than Rs.30000 and now in April 2018, the per share Price of MRF is more than Rs.80000. If someone has invested in money around 2016 then, he or she have made more than 160% money as capital Appreciation.

Another Example: Price of your house Rented to someone gives two incomes: Increase in Price of Property as capital appreciation and Rental Income as Dividend, although rental income does not depend on Paying Guest right, it is decided by you right?

Dividend Yield:
Dividend Yield is represented in terms of percentage. It is the ratio of annual dividend per share and price per share. How much a company paid to its shareholders as a percentage of its share price. 
The higher Dividend yield is attractive for majority people, it is like extra income. Which is attractive.


  6)EPS or Earning per share:
    The most important financial ratio of a company is EPS or Earning per share. It is clear from its name, it is earning per share by a company. 
   It is always for some particular time period. Generally, EPS used of Trailing twelve months or EPS(TTM) which is the sum of EPS of last for Quarter. The formula for calculating EPS for a particular period is as below:
EPS = (Net profit of company / Total Number of outstanding Shares)

  EPS of a company having the net profit of Rs.100 cr and Total Number of shares outstanding 10 cr is EPS= (100/10) = RS.10 per share.

  7)Price to Earnings Ratio or P/E ratio:
  Another most important Ratio is Price to  Earning or P/E ratio, it is defined as the current market price of the share of a company by its EPS or Earning per share of a company. Highest the P/E ratio, richest the valuation of a company.

PRICE TO EARNING OR P/E = (current Market Price of a Share / EPS for that company)

i.e. P/E of a company having price rs 200 and EPS RS.20 will be P/E =(200/20)=10x (10times)

  8)Industry P/E:
  Industry P/E is PRICE to Earning multiple of the whole industry. By Comparing a company’s P/E ratio with its industry’s P/E one can identify, is company overvalued or undervalued?

  P/E < Industry P/E   Then Undervalued
  P/E > Industry P/E   Then Overvalued
  P/E = Industry P/E   Then fairly valued

  9)Deliverables:
  It is the percentage of delivery from traded quantity for a particular period of time. You can find deliverables for any company at its respected Stock Exchanges. (Exp. NSE, BSE, MCX, NYSE). 
  
  Higher percentage delivery is a good sign for a company for that particular price.

 10)Market Lot:
  It is a minimum quantity of shares which one can able to trade. It is different for the company to company. Generally, in India Market lot is 1 share for most companies (except SMEs (Small and Medium Enterprises)).

This was 10 most important fundamentals of a company. If you find helpful above information then please Share our articles and Subscribe to the newsletter of our blog.