STOCK'S KNOWS
Showing posts with label Candlestick Patterns. Show all posts

Friday, May 4, 2018

Candlestick Patterns: Part 3

Candlestick Patterns: Part 3

Hey friends, welcome to Stock’s Knows. This is 3rd and final part of candlestick patterns. In this part, we will understand candlestick patterns formed by more than two candles.
   
  1)Morningstar:
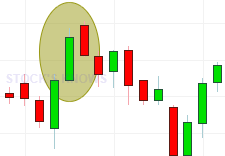
  Morningstar pattern is strong bullish reversal pattern having three candles in it. The 1st candle is always a long bearish candle .2nd candle is like spinning Top or doji (Shows indecision). The 3rd candle is long bullish candle need to close above the midpoint of a 1st candle. Generally forms at the end of a downtrend and after that uptrend will start.

  2)Evening Star:
The evening star is strong bearish reversal pattern and also made of three candles. The 1st candle is always a long bullish candle. 2nd candle shows indecision (small body and long shadows). The 3rd candle is a long bearish candle and needs to close below the midpoint of the 1st candle. It generally forms at the end of an uptrend and indicates the upcoming downtrend.

  3)Three white soldiers:
Three white soldiers pattern is a strong bullish reversal pattern if forms after consolidation or downtrend. The 1st candle is bullish, close near high. 2nd candle opens within the range of 1st candle and close above high of the 1st candle and need to have a longer body than the 1st candle. 3rd candle opens within the range of 2nd candle and closes above the high of the 2nd candle.


  4)Three Black crows:
Three black crows pattern is a strong bearish reversal pattern if forms after consolidation or uptrend. The 1st candle is bearish, close near low. 2nd candle open within the range of 1st candle and close below low of a 1st candle. The 3rd candle must be big bearish, which opens within the range of 2nd candle and close below the low of the 2nd candle. All the three candles have no or small shadow.


  5)Three inside up:
Three inside up is also a strong bullish reversal pattern. The 1st candle is the bearish candle, shows that market is still bearish. The 2nd candle is bullish and shorter and closes above the midpoint of the 1st candle. The 3rd candle is long bullish candle close above high of 2nd and above high of the 1st candle.

  6)Three inside down:
Three inside down is a strong bearish reversal pattern. The 1st candle must be the bullish candle, shows that market is still bullish. The 2nd candle is bearish and shorter and closes below the midpoint of the 1st candle. The 3rd candle is long bearish candle close below the low of the 2nd candle and below the low of the 1st candle.


This was all about candlestick patterns. You need to learn and practice to analyze it. More practice is more helpful for any chartist.
If you find helpful above information then please Share our article and Subscribe to the newsletter of our blog.  


Candlestick Patterns: Part 2

Candlestick Patterns: Part 2

Hey friends, welcome to Stock’s Knows. This is the 2nd part of candlestick pattern article. In this article will understand candlestick patterns formed by 2 candlesticks.

  1)Bullish Engulfing:
  Bullish Engulfing candlestick pattern forms by 2 candles, the first candle is generally small and bearish, the 2nd candle is bullish and long. 2nd candle engulfs the first one. This type pattern is known as a Bullish Engulfing pattern. It is a bullish reversal pattern and in most of the cases, it found near the bottom at the end of the downtrend. If next candle closes above the high of a 2nd candle, it clearly indicates upcoming uptrend. 

Bullish Engulfing as bullish reversal pattern


  2)Bearish Engulfing:
  It is also two candle pattern. The 1st candle is always small and bullish, a 2nd candle is long and bearish. 2nd candle fully engulfs the first one. It majorly forms at the end of uptrend hence it is a bearish reversal pattern. When 3rd candle will close below the low of the 2nd candle, it clearly indicates an upcoming downtrend.

Bearish Engulfing Candlestick Pattern as Bearish reversal


 3)Bullish Harami:
 Bullish Harami pattern is a mirror image of the bullish engulfing pattern. In bullish harami pattern, the 1st candle is long and bullish. The 2nd candle is small and bearish. A 2nd candle always in between high and low of the first candle. It forms generally at the bottom, end of the downtrend. It is a bullish reversal pattern. If 3rd candle closes above 1st candle’s high, it clearly indicates upcoming uptrend.

Bullish Harami Candlestick Pattern as Bullish reversal

4)Bearish Harami:
Bearish Harami pattern is the mirror image of the Bearish Engulfing pattern. The 1st candle is always long bearish candle and the 2nd candle is always small bullish candle. 2nd candle forms in between High and low of the 1st candle. It is bearish reversal pattern and forms generally at the end of an uptrend. If 3rd candle closes below Low of the 1st candle, it is clear indication of the upcoming downtrend.
Bearish Harami candle as bearish reversal pattern

5)Dark cloud cover:
Dark cloud cover is also bearish candlestick pattern. In this pattern, the 1st candle is a strong bullish candle, but the 2nd candle is a strong bearish candle and opens above the high of the 1st candle, close below the midpoint of the first candle. It forms near the resistance zones.


Dark Cloud Cover as Bearish Reversal pattern

6)Piercing Line candlestick pattern:
Piercing Line pattern is just mirror image of Dark cloud cover pattern. The first candle is always strong bearish candle and 2nd candle open below the low of the 1st candle and close above the midpoint of the 1st candle. It is a bullish reversal pattern. It generally forms near the support zone.

Piercing Line as Bullish reversal pattern

7)Tweezer tops:
The tweezer top is the bearish reversal pattern. A 1st candle is the strong bullish candle and closes at high. The 2nd candle is a bearish pattern and opens at high-level decrease to a lower level. Highs of both candles are almost same. It generally forms at the end of an uptrend.

Tweezer Top as Bearish reversal pattern

8)Tweezer bottoms:
The tweezer bottom is the bullish reversal pattern. The 1st candle is the strong bearish candle, close at the low level. 2nd candle open at low and increase from that level and close near high. Lows of both candles are almost same. It generally forms around support zones and at the ending of the downtrend.
Tweezer Bottom as Bullish reversal pattern


This was the 2nd part of candlestick pattern article. In 3rd part, we will understand about candlestick pattern formed by more than two candles. If you find helpful above information then please Share our article and Subscribe to the newsletter of our blog.  

Thursday, May 3, 2018

Candlestick Patterns: Part 1

Candlestick Patterns: Part 1

Hey friends, welcome to Stock’s Knows. This is the 4th article of technical analysis. In this article, we will learn about some candlestick patterns and their interpretation. Candlestick charts are most useful charts because different types of candlestick patterns have their different interpretation which is very helpful to understand the market.
    
  1)Marubozu:
   A candlestick pattern which has the only body but no shadow or small shadow is known as marubozu. A rarely found marubozu candlestick pattern is of both types bullish and bearish. For bullish marubozu, always open equals Low and Close always equals high, in bearish Marubozu open equals High and Close equals Low. Marubozu type candlestick pattern can be both continuation and reversal pattern.

Morubozu bearish and bullish candles
Marubozu as Bullish continuation pattern:
If you find Bullish marubozu in the uptrend, it indicates the continuation of that uptrend.
Example of bullish marubozu

Marubozu as Bullish reversal pattern:
If you find Bullish marubozu after the downtrend, it is the indication of a reversal of trend and uptrend may be coming.
Example of bullish reversal by marubozu


Marubozu as Bearish Continuation pattern:
If you find Bearish marubozu in the downtrend it is the indication of the continuation of that downtrend. 
Bearish Marubozu as bearish continuation pattern

Marubozu as bearish reversal pattern:
If you find bearish marubozu after the uptrend, it is the indication of trend reversal may be coming.
Bearish marubozu as bearish reversal pattern


2)Spinning top :
    In spinning top candlestick pattern, a body is very small as compare to shadows. Generally, shadows are more than double size of the body. This looks like a spinning top toy, so it named as spinning top candle. It is the sign of indecision and it generally forms at the end of an uptrend or a downtrend. After spinning top candlestick pattern one need to wait for next candle, which will indicate the situation.
Spinning Top candlestick pattern can indicate both bullish and bearish reversal.

Spinning top as bullish  trend reversal:
Spinning Top example

Spinning Top as Bearish Trend Reversal:
Spinning top as Trend reversal


  3)Doji:
    Doji patterns have very small or nobody and long shadows, there are four types of doji patterns:

a)Gravestone doji,
b)Dragonfly doji,
c) Doji 
d)Long-legged Doji

    a)Gravestone Doji generally forms after an uptrend and it is the indication of the end of an uptrend or reversal of an uptrend and downtrend might start.
Gravestone Doji as bearish reversal

b)Dragonfly doji generally forms after a downtrend and it is the indication of an end of downtrend or reversal of trend and uptrend might start.

Dragonfly Doji as bullish reversal

 c)Doji forms both after the uptrend or after the downtrend. If it forms after the uptrend, it indicates the bearish trend reversal. If it forms after the downtrend, it indicates the bullish trend reversal.

Doji as Bearish reversalDoji as Bullish reversal

d)Long-legged doji forms after both of trends. If it forms after uptrend it indicates the bearish trend reversal ( or indecision) and if it forms after downtrend it indicates bullish trend reversal (or indecision).
Long Legged Doji

     3)Hammer and Inverted Hammer pattern:


 i)Hammer candlestick pattern looks like the hammer, it has the small body, small upper shadow, and longer lower shadow. There is no bullish or bearish hammer, hammer generally forms after significant downtrend near the bottom of the downtrend. whether it has the bullish body or bearish body it indicates that bottom may be hammered out and uptrend might start. Price will go up from here.
Hammer candlestick pattern as bullish reversal pattern

ii)Inverted hammer candlestick pattern looks like the inverted hammer, it has the small body, small lower shadow, and long upper shadow. Generally, length of the shadow is more than double of the length of the body. It generally forms after both uptrend and downtrend. If it forms at the bottom, after significant downtrend it indicates that buyers are coming back and sellers are exhausted.


Inverted Hammer as Bullish reversal candlestick pattern
iii)Shooting star:
   If inverted hammer form at the top, after significant uptrend it is known as shooting star because it looks like when a star shooting from the sky. If low of shooting star breaks in next candle it clearly indicates of bearish reversal and downtrend might come because of sellers are back in the game.

Shooting star Candlestick as Bearish reversal

This was the part 1 of candlestick patterns, in 2nd part will understand candlestick patterns formed by more than one candle. If you find helpful above information then please Share our article and Subscribe to the newsletter of our blog.