
Hey friends, welcome to Stock's Knows.
This is the 2nd article of technical analysis of stocks , in our first article of technical analysis of stocks we learned three basic principles of Technical Analysis.
Today we will understand the very basic concept of Technical Analysis of Stocks which is known as Support and Resistance levels.
This is the 2nd article of technical analysis of stocks , in our first article of technical analysis of stocks we learned three basic principles of Technical Analysis.
Today we will understand the very basic concept of Technical Analysis of Stocks which is known as Support and Resistance levels.
Before starting about Support and Resistance level we need to understand types of charts used in technical analysis of stocks which are given below:
Three basic chart types:
1) Line Chart:
Line chart looks like a line, it is very simple and basic representation of chart. The line chart shows the only closing price of a security during the particular time period.

Nifty50 Line Chart
2) Bar chart:
Bar chart looks as shown in below picture. In the bar chart, a bar type representation formed by using information of open, high, low and close price of a security.

Nifty50 Bar Chart
3) Candlestick chart:
Most famous and majority technical analysts use candlestick charts, by using high, low, open and close price for the particular time period, a candle type representation is formed in candlestick chart. Candle's color is decided by the price action of open and close:
If Close > Open then Green
If Close < Open then Red

(There is no hard and fast rule for the color of candles you can change as you want.)
Same as in all type chart you can analyze from 1-minute candlestick chart to 1-month candlestick chart.
Now we need to understand the very basic topic of technical analysis, without using it, one cannot able to predict the price of any tradable security.
Support and Resistance Levels:
We already know that market does not move like a straight line, it always moves in trends.
In this journey of the market we can find some levels from where the direction of the market starts to reverse its trend those levels are known as support and resistance levels.
In this journey of the market we can find some levels from where the direction of the market starts to reverse its trend those levels are known as support and resistance levels.
Suppose the market is in an uptrend and from any level, it changes its direction to downtrend then that level is known as a resistance level.
And if the market is in a downtrend and from any levels, it stops its downtrend and goes to the direction of uptrend then those levels are known as support levels.
It is very important to identify support and resistance levels for any tradable security.
Because by using support and resistance, we can predict the price and direction of the price of any tradeable security.
Because by using support and resistance, we can predict the price and direction of the price of any tradeable security.
How to identify Support and Resistance levels?
To identify support or resistance levels, one needs to find trend reversal points of price in a chart of any security.
From where Uptrend becomes downtrend, or downtrend becomes uptrend.
Method to Identify Support and Resistance is given below picture.
From where Uptrend becomes downtrend, or downtrend becomes uptrend.
Method to Identify Support and Resistance is given below picture.
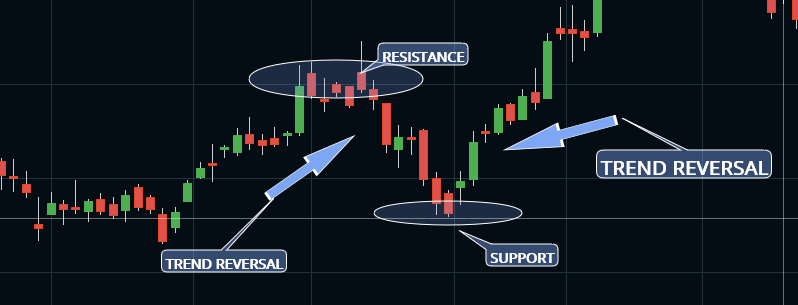 |
| Trend reversals from support and resistances |
Important things to remember about Support and Resistance levels:
- Resistance will become support, if price crosses that level and sustains above it and support will become resistance, if price cross it and sustains below it.
 |
| Resistance became Support |
- Support and Resistances are levels, not just simple lines, they are regions of support and resistances.
 |
- Importance of support and resistance will increase in the proportion of the number of time they are tested. More time-tested resistance or support levels are more important than less time-tested levels.
- It is very important to remember that there is always demand available near support levels and supply available near resistance levels.
How to use Support or Resistances for Trading?
Having lots of information is meaningless if you don't know how to use that information.
Same in the technical analysis also, if you know the concept of support and Resistance levels but don’t know how to use that concept to improve your analysis, then there no benefit for it.
Uses of support and resistances are very much important.
Suppose the price of any security is started from Rs.101 and faced resistance at 105, after some time it successfully crossed 105 with high trading volume, then you can predict the next level of resistance this way:
- Find the difference between breakout level and support level (In above case 105-101=4).
- Add it to breakout level (105+4=109).
- This will be your target or next possible resistance level(109).
In above example, we found the target of 109, but what if the price will not increase to 109 level and go below 105, 104, 103, 102..., this is known as a false breakout.
Our position will become losing position.
For avoiding those condition you need to find risk and reward both while analyzing charts.
For avoiding those condition you need to find risk and reward both while analyzing charts.
In trading we always need to look on both side until price doesn't fall below this level, there is a high probability that price will go around this level.
And if fall below this level one needs to exit in a loss to limit his or her loss.
And if fall below this level one needs to exit in a loss to limit his or her loss.
In above example we found breakout level at 105 and our calculated target is 109 but risk calculation depends on our risk taking capacity.
If one is conservative trader and is able to take Rs.1 risk to get Rs.4 then risk level is 104 (breakout level-Risk capacity)for his or her trade.
And if price will go below 105 , he or she will wait until price is above 104, if price will go below 104 he will exit immediately with loss of Rs.1 per share.
Limiting your loss is a most important thing in trading.
And if price will go below 105 , he or she will wait until price is above 104, if price will go below 104 he will exit immediately with loss of Rs.1 per share.
Limiting your loss is a most important thing in trading.
We will discuss Risk Reward, Target, Stop loss and where to put that to limit loss in our another article of Basics of Trading.
If you find helpful above information then please Share our articles and Subscribe newsletter of our blog.


