Hey friends, welcome to Stock’s Knows. This is the third part of chart patterns’ article. Today we will understand most reliable three continuation chart patterns: Symmetrical Triangles, Ascending Triangle, Descending Triangle.
1)Symmetrical Triangle:
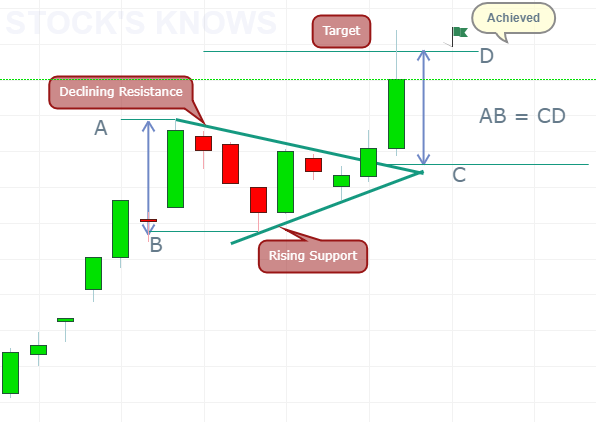
Symmetrical Triangle chart pattern forms by two lines, declining upper line(or resistance) and rising lower line(or support). A symmetrical triangle is both bullish and bearish type. Bullish symmetrical triangle forms in an uptrend and bearish symmetrical triangle forms in a downtrend. In a bullish symmetrical triangle, breakout expectation would be upward, in bearish symmetrical triangle breakout expectation would be downward.
How to trade?
1)Trade at initial breakout:
I)In the bullish symmetrical triangle, one should go long at the time of upside breakout.
II)In a bearish symmetrical triangle, one should go short at the time of downside breakout.
2)Trade while retest:
In both cases, one can wait for the candle to close above or below breakout level and enter while retesting of breakout level.
Bullish Symmetrical Triangle
Bullish Symmetrical Triangle
 |
| Image Source:Investing.com |
Stop loss in bullish case:
1)Below the low of candle closed above breakout level.
2)Below the midpoint of the triangle.
3)Below the lower line of the triangle.
Stop loss in bearish case:
1)Above the high of candle closed below breakout level.
2)Above the midpoint of the triangle.
3)Above the upper line of the triangle.
How to calculate Target:
For target, one needs to calculate price difference between widest points of the triangle and project it above or below from breakout level as per bullish or bearish triangle breakout.
2)Ascending Triangle:
The ascending triangle is a bullish continuation pattern. It is a combination of two lines, almost flat resistance or upper line and rising support or lower line. This pattern is the indication of buyers are more aggressive than sellers. This pattern generally forms in an uptrend.
Sometimes it acts as a bullish reversal pattern if forms in the downtrend.
How to trade?
1)Trade at initial breakout:
This pattern is strong bullish continuation pattern; hence one should go long while initial breakout. Sometimes this method proved risky.
2)Trade while retest:
For comfort, one can wait to successful breakout, minimum one candle close above the breakout level. Trade when retest of breakout level happens. This method gives comfort and confidence.
Stop loss options:
 |
| Image source:Investing.com |
1)Below the low of candle closed above breakout level.
2)Below the midpoint of the triangle.
3)Below the lower line of the triangle.
How to calculate Target:
For target, one needs to calculate price difference between widest points of the triangle and project it towards breakout direction from breakout level. One can also use next resistance level as the target.
3)Descending Triangle:
This pattern is the indication of sellers are more aggressive than buyers. Hence it is a bearish continuation pattern. Sometimes it acts as a bearish reversal pattern if forms after an uptrend. It forms by two lines, flat lower line or support and declining upper line or resistance.
How to trade?
1)Trade at initial breakout:
One should go short at the time of initial breakout.
2)Trade while retest:
For comfort, one can wait for the successful breakout below breakout level and trade while retesting of a breakout.
Stop loss options:
1)Above the high of candle closed below breakout level.
2)Above the midpoint of a triangle.
3)Above the upper line of the triangle.
How to calculate target?
For target, one needs to calculate price difference between widest points of the triangle and project it below the breakout level. One can also use next support level as the target.
In all three triangles, stop loss and target calculation is almost same but the direction is different.
These were three most comfortable continuation patterns. In next article, we will understand flag and pennant patterns. If you find helpful above information then please Share our article and Subscribe to the newsletter of our blog.


