STOCK'S KNOWS
Showing posts with label Technical Analysis. Show all posts

Thursday, May 3, 2018

Candlestick Patterns: Part 1

Candlestick Patterns: Part 1

Hey friends, welcome to Stock’s Knows. This is the 4th article of technical analysis. In this article, we will learn about some candlestick patterns and their interpretation. Candlestick charts are most useful charts because different types of candlestick patterns have their different interpretation which is very helpful to understand the market.
    
  1)Marubozu:
   A candlestick pattern which has the only body but no shadow or small shadow is known as marubozu. A rarely found marubozu candlestick pattern is of both types bullish and bearish. For bullish marubozu, always open equals Low and Close always equals high, in bearish Marubozu open equals High and Close equals Low. Marubozu type candlestick pattern can be both continuation and reversal pattern.

Morubozu bearish and bullish candles
Marubozu as Bullish continuation pattern:
If you find Bullish marubozu in the uptrend, it indicates the continuation of that uptrend.
Example of bullish marubozu

Marubozu as Bullish reversal pattern:
If you find Bullish marubozu after the downtrend, it is the indication of a reversal of trend and uptrend may be coming.
Example of bullish reversal by marubozu


Marubozu as Bearish Continuation pattern:
If you find Bearish marubozu in the downtrend it is the indication of the continuation of that downtrend. 
Bearish Marubozu as bearish continuation pattern

Marubozu as bearish reversal pattern:
If you find bearish marubozu after the uptrend, it is the indication of trend reversal may be coming.
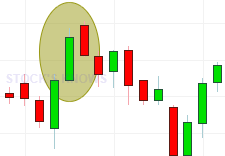
Bearish marubozu as bearish reversal pattern


2)Spinning top :
    In spinning top candlestick pattern, a body is very small as compare to shadows. Generally, shadows are more than double size of the body. This looks like a spinning top toy, so it named as spinning top candle. It is the sign of indecision and it generally forms at the end of an uptrend or a downtrend. After spinning top candlestick pattern one need to wait for next candle, which will indicate the situation.
Spinning Top candlestick pattern can indicate both bullish and bearish reversal.

Spinning top as bullish  trend reversal:
Spinning Top example

Spinning Top as Bearish Trend Reversal:
Spinning top as Trend reversal


  3)Doji:
    Doji patterns have very small or nobody and long shadows, there are four types of doji patterns:

a)Gravestone doji,
b)Dragonfly doji,
c) Doji 
d)Long-legged Doji

    a)Gravestone Doji generally forms after an uptrend and it is the indication of the end of an uptrend or reversal of an uptrend and downtrend might start.
Gravestone Doji as bearish reversal

b)Dragonfly doji generally forms after a downtrend and it is the indication of an end of downtrend or reversal of trend and uptrend might start.

Dragonfly Doji as bullish reversal

 c)Doji forms both after the uptrend or after the downtrend. If it forms after the uptrend, it indicates the bearish trend reversal. If it forms after the downtrend, it indicates the bullish trend reversal.

Doji as Bearish reversalDoji as Bullish reversal

d)Long-legged doji forms after both of trends. If it forms after uptrend it indicates the bearish trend reversal ( or indecision) and if it forms after downtrend it indicates bullish trend reversal (or indecision).
Long Legged Doji

     3)Hammer and Inverted Hammer pattern:


 i)Hammer candlestick pattern looks like the hammer, it has the small body, small upper shadow, and longer lower shadow. There is no bullish or bearish hammer, hammer generally forms after significant downtrend near the bottom of the downtrend. whether it has the bullish body or bearish body it indicates that bottom may be hammered out and uptrend might start. Price will go up from here.
Hammer candlestick pattern as bullish reversal pattern

ii)Inverted hammer candlestick pattern looks like the inverted hammer, it has the small body, small lower shadow, and long upper shadow. Generally, length of the shadow is more than double of the length of the body. It generally forms after both uptrend and downtrend. If it forms at the bottom, after significant downtrend it indicates that buyers are coming back and sellers are exhausted.


Inverted Hammer as Bullish reversal candlestick pattern
iii)Shooting star:
   If inverted hammer form at the top, after significant uptrend it is known as shooting star because it looks like when a star shooting from the sky. If low of shooting star breaks in next candle it clearly indicates of bearish reversal and downtrend might come because of sellers are back in the game.

Shooting star Candlestick as Bearish reversal

This was the part 1 of candlestick patterns, in 2nd part will understand candlestick patterns formed by more than one candle. If you find helpful above information then please Share our article and Subscribe to the newsletter of our blog.  

Tuesday, May 1, 2018

Basics of trading and important things to know while trading.

Basics of trading and important things to know while trading.

Hey friends, welcome to Stock’s Knows. This is the 3rd article of Technical Analysis, in today’s article, we will know Basics of Trading.

What is Trading?
Trading is a method to make a profit from buying and selling shares or security or currency during the shorter time frame. There are different types of traders in the market. Risks, rewards and time frames are different for different types of traders. We can classify mainly three types of traders shown in the market.

   1)Intraday Trader:
   An intraday trading is a method to get profit from changes in the price of shares during the day. An intraday trader needs to close his opened position before closing the market, whether it is a profitable position or losing position. Intraday traders are players which play in direction of Market.

Intraday traders always try to book their profit quickly or cut loss quickly. Though intraday trading removes the overnight risk of carrying shares, it is not the easy task to do.

     2)Positional Trader:
     Positional trading is like day trading but positional traders do not square off their position before closing the day but they take their position in any security and hold for some days to the week and try to get profit from changes in share price during some time period. 

 Although it consists of overnight carrying risk, as per my view in positional trading you have some more time as compare to intraday to take decisions as per your risk or reward capacity. They book profit or cut losses as per their plan on basis of the movement of share or security price. 

   3)Short term or Swing Trader:
   Short term or swing trading is trading for a time period of 1 week to 4 weeks. A swing trader always tries to get profit from market swings during some weeks. Swing trading also carries Overnight holding risk but it is less risky as compared to intraday and positional trading as per my view.

They always buy at low and sells at high. Risk and reward in swing trading are different from both above types of trading. Though all types of trading are risky but if you trade strictly as per your plan, you will get profit in the long run.

Some important things to decide while trading:
     
  1)The risk to reward ratio:
The risk to reward ratio is first important thing while trading. The risk to reward ratio is defined as: How much reward you expect per share while taking risk of Rs.1 per share. 

If you expect Rs.5 per share as a reward while taking risk of Rs.1 per share your risk to reward ratio will be “1:5” (Risk: Reward or Risk/Reward). Higher the reward compares to risk better it is. A ratio of 1:5 is better than 1:1 ratio.

For different type trader risk to reward is a different but minimum risk to reward ratio is always 1:1 because minimum reward while taking risk of Rs.1 per share is not less than Rs.1 per share.

  2)Target:
Target is a level near that one need to book full or partial profit. Booking profit is very important because the market is always volatile and if someone waits for more and more profit and not book profit, it is possible that market may reverse its direction and profitable position will become losing position. 

To avoid those scenarios one needs to set the target and continue to book at least partial profit. In above condition trailing stop loss will help you.

  3)Stop loss:
In any type of trading cutting losses is as much important as booking profit. STOP LOSS is a level beyond that one need to square off his position to cut the loss as per his risk-carrying capacity.

As per trader’s risk to reward ratio and on the basis of charts, stop loss must be decided. Because of news, events, and volatility, the market can change its direction any time. 

To protect himself from that volatility and to limit the losses, one always need to place stop loss orders. 

If you are in buy side, your stop loss level would be just below the nearest support level, if you are in sell-side your stop loss level must be above the nearest resistance level. 

There are many support and resistances possible in any price range, one needs to decide that where to put stop loss as per his risk to reward ratio and as per his trading style. 

There are different stop loss levels in the same position for Intraday or Positional or swing trader. 

In trading, many people because of emotions prevent to cut losses earlier and think the market will reverse to give him reward so they hold their positions but an ideal trader do the exact opposite of it, he always tries to cut losses quickly and try to run his profitable position

Thinking that market will reward me because so and so reason is not good quality of a trader. 

Accepting whatever real condition is, the best quality of a trader. If you want to be profitable in trading you need to do like the ideal trader.
              
 Types of STOP LOSS:
    
    1)Trailing stop loss:
      Trailing stop loss is moving stop loss which moves in favor of the position as price goes in favor of the opened position. 

   If you have bought some shares at 200 and your stop loss is at 196, suppose price moves from 200 to 204 then you need to increase stop loss from 196 to 200, in this condition your trade is protected and you won’t lose anything. 
   After sometime price further increases to 208 then you need to increase your stop loss to 204, in this condition your profit of Rs.4 per share is locked and in any market condition you will get minimum that profit. This is known as trailing stop loss.

  No.  CONDITION       STOP LOSS      PRICE
  1)  Just Bought        196           200
  2)  After some time    200           200
  3)  More time passed   200           208


    2)Fixed stop loss:
   After understanding about trailing stop loss, you will think people need to always use trailing stop loss, but it is not true. 

Sometime trailing stop loss will give unnecessary losses, because in the highly volatile market it is possible that price of purchased share suddenly decrease and hit your stop loss and quickly increase from that level and hit your target, but your position was squared off and you will get the unnecessary loss. 

So trailing stop loss is a good idea but not in all cases. In the highly volatile market, you have to increase your risk, need to find strong support below that you can put stop loss, to increase the probability of hitting it. 

In that case, you can not trail your stop loss. This type of Stop loss is known as strict or fixed stop loss.

This was some basic and important things of trading.

If you find helpful above information then please Share our articles and Subscribe to the newsletter of our blog.  

Saturday, April 21, 2018

Do we all are already Technical Analysts?

Do we all are already Technical Analysts?
Hey friends, welcome to Stock's Knows. Today's topic of the article is Technical Analysis of stocks. In share market, if you want to trade or even want to find perfect price for buying or selling any shares, you need to analyze stocks. There are mainly two types of analyzing a method to analyze any security: 

    1) Technical Analysis 

    2) Fundamental Analysis. 

Technical Analysis is mostly used by Traders. But some long-term investors also use some sort of Technical Analysis for finding perfect Entry or Exit price of any security. In this article, we will understand about Technical Analysis. 

"Technical Analysis is a method to predict the direction of the price of a security by using a combination of price and volume actions and Patterns made by it."
Three basic principles of Technical Analysis:

1)Price discounts Everything:
In technical analysis, we need to assume that all the information and news of the market is discounted in the price of a security so if we only analyze price and volume of security, all the information and news for security and impacts of it on any particular security automatically analyzed. Price and volume are indicators of any news related to Share or security.  

2)Price Moves in trends:
Technical Analysts believe that Price of any tradable instruments moves in trends. There are three types of trends: 

   1)Uptrend:
   If price moves in direction of Upside while making Higher highs and higher lows, this trend is known as Uptrend. 
   2)Downtrend:
   If the price of any security or tradable instrument moves in downside while making lower highs and lower lows, this trend is known as Downtrend.
   3)Consolidation:
   If price nighter makes higher high and higher low nor make lower high and lower low and moves between a range of two levels, this type of trend is known as consolidation or range bound trend.


3)History Repeat itself:
Technical Analysts believe that all the patterns made by price in present will repeat in future and patterns made by price in past will also repeat in future. Hence all the patterns or combination of patterns will repeat itself in the chart of any tradable security. All the History made by price will repeat itself. Ex. In past, if the price was fallen from any specific level, in future also it will also fall from that specific level.

Using these three assumptions all the technical analysts analyze the present condition of price and volume, after that on the basis of history predict the future direction of the price of any tradable security.

The major benefit of Technical analysis is that it is applicable to any tradable security like Crude oil, Currency pairs, stocks, futures, indices in the same way. 

Want to understand Technical Analysis with simple example Checkout my video on Technical Analysis. 


In this video, I have explained what the Technical Analysis means. Maybe you don’t know but you are already a Technical Analyst.

In our life, we nearly every day analyze Price and Volume of products or things we have to buy. Isn't it strange we all are doing Technical Analysis without our knowledge? 

In the video, I have taken the example of buying the tomato. Suppose one day you went to Vegetable market and bought 1 kg tomato at the price of Rs.50/kg. 

Now the second day again you visited the vegetable market, as soon as you entered you found that supply of tomato as compare to yesterday is very much higher and buyers are less as compare to yesterday. 

What do you think first about the price of tomato in the second day? More than Rs.50 or less than Rs.50? Less than Rs.50 right. 

How do you know that? By comparing the volume of tomato of both days and price of the first day, we can predict the range of price for buying a tomato. Due to high supply and fewer buyers we found that more supply and Low demand will lead to drop in the price of anything. 

You can similarly apply these basic rules to any market, in the stock market also. But in the stock market at wall street, you also find buyers and sellers of shares and analyze price, demand, and supply of shares. 

But because of advances in technology, all things like buying and selling of shares become computerized now, hence we can directly not able to visualize supply and demand changes but for that, we need to study charts of price and volume of any security or share. Charts are drawn as price vs time, which shows what is the price at what time. 

There are many websites available which provide readymade charts for any listed securities or shares you need to select a time period for which you need a chart to analyze. You can select ranges from 1 minute to 1 month. If you select 1 minute then you will get a chart of every 1 minute and analyze the movement of price in every minute, if you will select 1 month then you will get a chart of everyone month and able to analyze movements of price in every month. 

There was the basic info of Technical Analysis this is not enough to analyze any tradable security. There are many other things you need to learn for Technical Analysis, you will find all the articles about Technical Analysis, fundamental analysis and also get views of mine for some good companies to invest or trade for longer to the shorter term. 

If you find helpful above information then Share our article and Subscribe to the newsletter of our blog.