Wednesday, July 4, 2018
Tuesday, June 12, 2018

Hey friends, welcome to STOCK'S KNOWS. Today's article is about the Technical view of SBI (State Bank Of India).
SBI today closed around 282.85, our view on sbi is to buy around 282.
Saturday, May 26, 2018

Hey friends, welcome to Stock's Knows. Today we will understand about a charting tool which is commonly used by technicians to identify perfect entry and exit points in any trade. Finding perfect entry and exit point is as much important as finding a perfect stock to enter.
Because if you find perfect stock but you entered at the wrong point, it will cost you money.
Hence we need to find perfect entry and exit points to enter into any trade.
Because if you find perfect stock but you entered at the wrong point, it will cost you money.
Hence we need to find perfect entry and exit points to enter into any trade.
Friday, May 11, 2018

Hey friends, welcome to Stock’s knows. In today’s article, we will understand most basic but most useful concept in technical analysis: TrendLines and Channels.
Thursday, May 10, 2018

Hey friends, welcome to Stock’s Knows. This is 4th part of chart patterns’ article. Today we will understand my favorite two chart patterns: Flags and Pennants. They are my favorite because they provide high reward as compared to risk, sometimes we can find 10 times reward as compared to risk. So, they are most rewarding chart patterns.
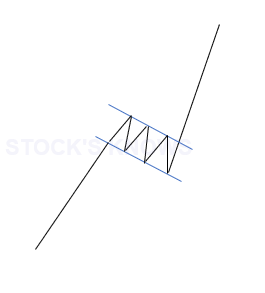
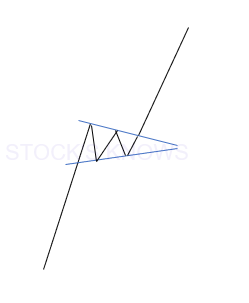
Flags and pennants both are continuation patterns and both form in the middle of the trends. They consist of poles and flags or triangles. Poles are previous directional moves in the direction of their trends. In the uptrend, after some upward moves, there was some consolidation period. Consolidation period looks like triangles or parallel channel.
The full pattern looks like flag or triangle connected with poles. As they are continuation patterns, they are both bullish and bearish type.
 |
| Flag |
 |
| Pennant |
The full pattern looks like flag or triangle connected with poles. As they are continuation patterns, they are both bullish and bearish type.
1)Bullish flag:
Bullish flag pattern forms in the middle of the uptrend. Hence it is a bullish continuation pattern.
 |
| Bullish Flag |
How to trade?
Trade when breakout happens. One can go long when breakout of bull flag pattern happens.
Where to put stop loss?
In a bull flag pattern, stop loss must be below flag level or below the previous low.
For target calculation, one needs to measure the length of the pole from starting of uptrend to flag and need to project it above the flag.
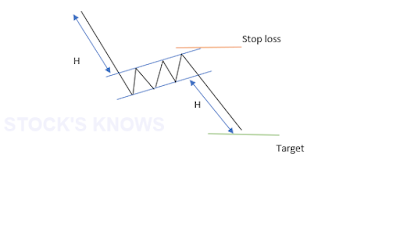
2)Bear Flag:
Bearish flag pattern forms in the middle of the downtrend. Hence it is a bearish continuation pattern.
To trade bear flag pattern, one needs to go short when breakout of flag happens.
Where to put stop loss?
Perfect stop loss level is above flag or above the previous high.
How to calculate Target?
 |
| Bearish Flag |
For target, one needs to measure the length of the pole from starting point of downward movement to the flag. And need to project it below the flag.
3)Bullish pennant:
Bullish pennant also forms in the middle of the uptrend. It is also bullish continuation pattern.
One can go long when breakout of pennant pattern happens.
Where to put stop loss?
Perfect stop loss would be below the pennant or below the previous low.
For target, one needs to measure pole length from starting uptrend to the pennant and need to project it to above pennant from breakout level.
4)Bearish Pennant:
Bearish pennant is the bearish continuation pattern. It also forms in the middle of the downtrend.
To trade bearish pennant pattern, one can go short when breakout of pennant happens.
Where to put stop loss?
Perfect stop loss would be above previous high or above pennant.
How to calculate Target?
 |
| Bearish Pennant |
To calculate target, one needs to measure the pole length from starting point of downtrend to the pennant and need to project it to below the pennant.
Note: You can use the entire length of the pole in all above cases to project 2nd target but in that case, you need to use trailing stop loss or need to book partial profit around the 1st target.
Note: You can use the entire length of the pole in all above cases to project 2nd target but in that case, you need to use trailing stop loss or need to book partial profit around the 1st target.
Those were two most rewarding continuation patterns. Remember that they look like triangles but they are smaller than triangles. If you find helpful above information then please Share our article and Subscribe to the newsletter of our blog.
Tuesday, May 8, 2018

Hey friends, welcome to Stock’s Knows. This is the third part of chart patterns’ article. Today we will understand most reliable three continuation chart patterns: Symmetrical Triangles, Ascending Triangle, Descending Triangle.
1)Symmetrical Triangle:
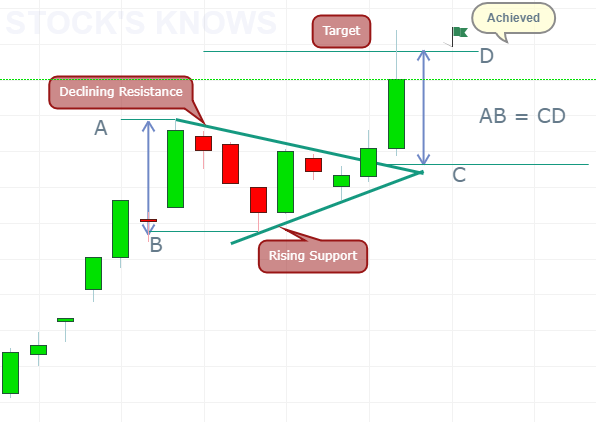
Symmetrical Triangle chart pattern forms by two lines, declining upper line(or resistance) and rising lower line(or support). A symmetrical triangle is both bullish and bearish type. Bullish symmetrical triangle forms in an uptrend and bearish symmetrical triangle forms in a downtrend. In a bullish symmetrical triangle, breakout expectation would be upward, in bearish symmetrical triangle breakout expectation would be downward.
How to trade?
1)Trade at initial breakout:
I)In the bullish symmetrical triangle, one should go long at the time of upside breakout.
II)In a bearish symmetrical triangle, one should go short at the time of downside breakout.
2)Trade while retest:
In both cases, one can wait for the candle to close above or below breakout level and enter while retesting of breakout level.
Bullish Symmetrical Triangle
Bullish Symmetrical Triangle
 |
| Image Source:Investing.com |
Stop loss in bullish case:
1)Below the low of candle closed above breakout level.
2)Below the midpoint of the triangle.
3)Below the lower line of the triangle.
Stop loss in bearish case:
1)Above the high of candle closed below breakout level.
2)Above the midpoint of the triangle.
3)Above the upper line of the triangle.
How to calculate Target:
For target, one needs to calculate price difference between widest points of the triangle and project it above or below from breakout level as per bullish or bearish triangle breakout.
2)Ascending Triangle:
The ascending triangle is a bullish continuation pattern. It is a combination of two lines, almost flat resistance or upper line and rising support or lower line. This pattern is the indication of buyers are more aggressive than sellers. This pattern generally forms in an uptrend.
Sometimes it acts as a bullish reversal pattern if forms in the downtrend.
How to trade?
1)Trade at initial breakout:
This pattern is strong bullish continuation pattern; hence one should go long while initial breakout. Sometimes this method proved risky.
2)Trade while retest:
For comfort, one can wait to successful breakout, minimum one candle close above the breakout level. Trade when retest of breakout level happens. This method gives comfort and confidence.
Stop loss options:
 |
| Image source:Investing.com |
1)Below the low of candle closed above breakout level.
2)Below the midpoint of the triangle.
3)Below the lower line of the triangle.
How to calculate Target:
For target, one needs to calculate price difference between widest points of the triangle and project it towards breakout direction from breakout level. One can also use next resistance level as the target.
3)Descending Triangle:
This pattern is the indication of sellers are more aggressive than buyers. Hence it is a bearish continuation pattern. Sometimes it acts as a bearish reversal pattern if forms after an uptrend. It forms by two lines, flat lower line or support and declining upper line or resistance.
How to trade?
1)Trade at initial breakout:
One should go short at the time of initial breakout.
2)Trade while retest:
For comfort, one can wait for the successful breakout below breakout level and trade while retesting of a breakout.
Stop loss options:
1)Above the high of candle closed below breakout level.
2)Above the midpoint of a triangle.
3)Above the upper line of the triangle.
How to calculate target?
For target, one needs to calculate price difference between widest points of the triangle and project it below the breakout level. One can also use next support level as the target.
In all three triangles, stop loss and target calculation is almost same but the direction is different.
These were three most comfortable continuation patterns. In next article, we will understand flag and pennant patterns. If you find helpful above information then please Share our article and Subscribe to the newsletter of our blog.
Sunday, May 6, 2018

Hey friends, welcome to Stock’s Knows. This is the 2nd part of Chart patterns' article, in this article we will understand another four chart patterns: double top – double bottom, triple top – triple bottom.
1)Double Top:
The double Top pattern forms by two prominent highs. It is a bearish reversal pattern. The graphical shape of the double top looks like “M”. When the price isn’t able to move above the first high, this is the first weakness point. When price moves below the low made between two highs, the double top pattern is completed.
How to trade?
To trade double top chart pattern for profit, one should go short when price moves below the low, made between two highs.
Stop loss:
Ideally, stop loss for this trade would be above some point of the low between two highs.
How to Calculate Target?
For target calculation, one needs to calculate price difference between highs and low formed between those highs and project it downside from breakout level.
2)Double bottom:
The double bottom chart pattern forms by two prominent lows. It is a bullish reversal pattern. The graphical shape of the double bottom is like “W”. When price doesn’t go below first low, this was the first indication of strength. When it moves above the high formed between two low levels, the double bottom is completed.
How to trade?
To trade double bottom chart pattern for profit, one should go long when price moves above the high formed between those two low levels.
Stop loss:
Ideal stop loss for this trade would be below the high, made between those two lows.
How to calculate Target?
For target calculation, one needs to calculate price difference between Lows and High formed between those low levels and project it to upside from breakout level.
 |
| Image source: Investing.com |
3)Triple Top:
The triple top chart pattern forms by three prominent highs (or tops). It is the strong bearish reversal pattern.
The triple top pattern is same as head and shoulder pattern. The only difference between them is that in triple top all the highs are at the same levels, whereas in head and shoulder pattern first and third highs at nearly same levels but the second high is at the higher level.
When we joint two lows formed between first and third highs, we get a line which is known as the neckline of this pattern. When price moves below neckline triple top chart pattern is completed.
How to trade?
To trade triple top chart pattern, one should go short, once price moves below the neckline (breakout level).
Stop loss:
Ideal stop loss for this trade would be above the neckline.
How to calculate target?
To calculate target, one needs to calculate price difference between neckline and highs. And should project it below from neckline.
 |
| Image source: Investing.com |
4)Triple bottom:
The triple bottom chart pattern forms by three prominent lows. It is a strong bullish reversal pattern.
Triple bottom chart pattern looks like an inverted head and shoulder pattern, the only difference between them is, in the inverted head and shoulder pattern 2nd low is lower than both first and third low, whereas in the triple bottom all three lows forms generally at the same level.
When we joint two highs between first and third highs, we get a line which is known as the neckline of this pattern. When price moves above the neckline, triple bottom chart pattern is completed.
How to trade?
To trade triple bottom, one should go long, once price moves above neckline (breakout level).
Stop loss:
Ideal stop loss for this trade would be below the neckline.
How to calculate Target?
To calculate target, one needs to measure price difference between neckline and lows. And should project it above from neckline.
 |
| Image source: Investing.com |
These were another four chart patterns which will be very helpful if one understand and do practice to find those patterns to predict price direction. If you find helpful above information then please Share our article and Subscribe to the newsletter of our blog.
Friday, May 4, 2018

Hey friends, welcome to Stock’s Knows. In the previous article, we have learned about Candlestick patterns and their interpretation.
Another important concept of technical analysis is chart patterns. Since market participants are Humans and it is a human psychology to repeat things. Like candlestick patterns, we can also find some chart patterns repeatedly in charts of any tradable security.
If we somehow know about those chart patterns and interpretation of them, it will be very helpful for us to analyze and predict the direction of price. From this article, we will learn all those chart patterns with their interpretation and also, we will understand how to trade them to get profit.
First, two chart patterns are Head and Shoulder pattern and Inverted Head and Shoulder Pattern.
1)Head and Shoulder Pattern:
Head and Shoulder pattern is a combination of three tops, in which 1st and 3rd tops are lower than the 2nd top, they look like left and right shoulders of a human. And the Second top looks like the head of a human. Graphical look of this pattern is like a human’s head with left and right shoulders. Hence this pattern’s name is head and shoulder pattern.
Head and shoulder pattern is a strong bearish reversal pattern. It generally forms at the end of an uptrend. In below picture, we can see, how head and shoulder pattern looks like. In the picture, we also see the neckline of Head and Shoulder, which is very important part of it.
Breakout:
Breakout of Head and Shoulder pattern happens if the price falls and closes below neckline with huge volume surge. Volume is very important at the breakout of any pattern.
How to trade?
One can go short when breakout of neckline happens with huge volume.
Stop loss ideally somewhere above the neckline.
For target, one needs to measure price difference between head and neckline and project it from neckline to below it.
Stop loss ideally somewhere above the neckline.
For target, one needs to measure price difference between head and neckline and project it from neckline to below it.
 |
| Image Source: Investing.com |
 |
| Image Source:Investing.com |
2)Inverted Head and shoulder pattern:
Inverted Head and Shoulder pattern is the inverse form of Head and Shoulder pattern. Inverted Head and Shoulder forms from three bottoms. First and third bottoms are higher than the second bottom. Inverted Head and Shoulder pattern is a strong bullish reversal pattern. It generally shows at the end of a downtrend. Below are the Inverted head and shoulder pictures. We can see neckline in that picture, which is also very important part of this pattern.
 |
| Image Source:Investing.com |
Breakout:
Breakout of Inverted Head and Shoulder pattern happens once price breaks Neckline with huge volume surge.
How to trade?
One can go long when breakout of neckline happens with huge volume surge.
Stop loss is ideally somewhere below the neckline.
For target, one needs to measure price difference between head and neckline and project it from neckline to above it.
Note: I have used JP ASSOCIATES chart only for an example, it is not the recommendation.
Stop loss is ideally somewhere below the neckline.
For target, one needs to measure price difference between head and neckline and project it from neckline to above it.
Note: I have used JP ASSOCIATES chart only for an example, it is not the recommendation.
This was Head and Shoulder twins patterns. In next part, we will learn more chart patterns. If you find helpful above information then please Share our article and Subscribe to the newsletter of our blog.

Hey friends, welcome to Stock’s Knows. This is 3rd and final part of candlestick patterns. In this part, we will understand candlestick patterns formed by more than two candles.
1)Morningstar:
Morningstar pattern is strong bullish reversal pattern having three candles in it. The 1st candle is always a long bearish candle .2nd candle is like spinning Top or doji (Shows indecision). The 3rd candle is long bullish candle need to close above the midpoint of a 1st candle. Generally forms at the end of a downtrend and after that uptrend will start.
2)Evening Star:
The evening star is strong bearish reversal pattern and also made of three candles. The 1st candle is always a long bullish candle. 2nd candle shows indecision (small body and long shadows). The 3rd candle is a long bearish candle and needs to close below the midpoint of the 1st candle. It generally forms at the end of an uptrend and indicates the upcoming downtrend.
3)Three white soldiers:
Three white soldiers pattern is a strong bullish reversal pattern if forms after consolidation or downtrend. The 1st candle is bullish, close near high. 2nd candle opens within the range of 1st candle and close above high of the 1st candle and need to have a longer body than the 1st candle. 3rd candle opens within the range of 2nd candle and closes above the high of the 2nd candle.
4)Three Black crows:
Three black crows pattern is a strong bearish reversal pattern if forms after consolidation or uptrend. The 1st candle is bearish, close near low. 2nd candle open within the range of 1st candle and close below low of a 1st candle. The 3rd candle must be big bearish, which opens within the range of 2nd candle and close below the low of the 2nd candle. All the three candles have no or small shadow.
5)Three inside up:
Three inside up is also a strong bullish reversal pattern. The 1st candle is the bearish candle, shows that market is still bearish. The 2nd candle is bullish and shorter and closes above the midpoint of the 1st candle. The 3rd candle is long bullish candle close above high of 2nd and above high of the 1st candle.
6)Three inside down:
Three inside down is a strong bearish reversal pattern. The 1st candle must be the bullish candle, shows that market is still bullish. The 2nd candle is bearish and shorter and closes below the midpoint of the 1st candle. The 3rd candle is long bearish candle close below the low of the 2nd candle and below the low of the 1st candle.
This was all about candlestick patterns. You need to learn and practice to analyze it. More practice is more helpful for any chartist.
If you find helpful above information then please Share our article and Subscribe to the newsletter of our blog.


